There are many Quality Learning tools for gathering the perspectives of groups of people: Consensogram, Parking Lot, Affinity Diagram, Plus/Delta, Fishbone Diagram, Force-field Analysis, to name a few.
Sometimes it’s desirable to gather views on more than one issue, and to examine the relationship between responses to these issues.
A Correlation Chart is useful for examining the relationship between responses.
Correlation Chart
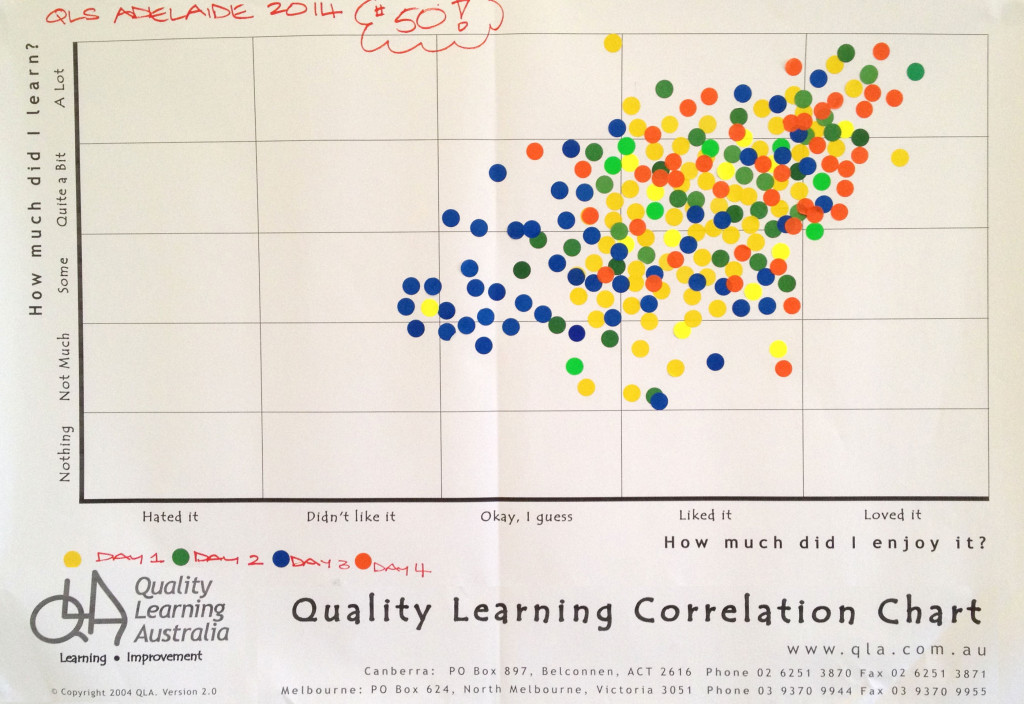
We regularly use a Correlation Chart as a quick and effective way to gather feedback from participants in our workshops. Figure 1 shows a Correlation Chart from a workshop – the 50th four-day Quality Learning Seminar with David Langford held in Australia.

Many teachers use a Correlation Chart at the end of a unit of work to gather student feedback on the unit.
Set the questions and scale
The first step when using a Correlation Chart is to decide the questions. The most common question are those shown in Figure 1, namely:
- How much did you enjoy the workshop/course/unit of work?
- How much did you learn?
The questions must lend themselves to a scaled response.
Binary questions, which have only two responses such as yes or no, don’t work for a Correlation Chart.
Scales we have seen used effectively include:
- Frequency: rarely to nearly always
- Importance: not important to critical
- Performance: very poor to excellent
- Amount: nothing to a lot
- Disposition: hate it to love it
- Knowledge: never heard of it to mastered it
- Confidence: not confident to supremely confident.
Whichever scale you choose, respondents will find it helpful if you define ‘anchor points’ along the scale. We typically define five such points. For example, for Frequency:
- Rarely (10%)
- Sometimes (25%)
- Moderately (50%)
- Mostly (75%)
- Nearly Always (90%)
Gather and display the data
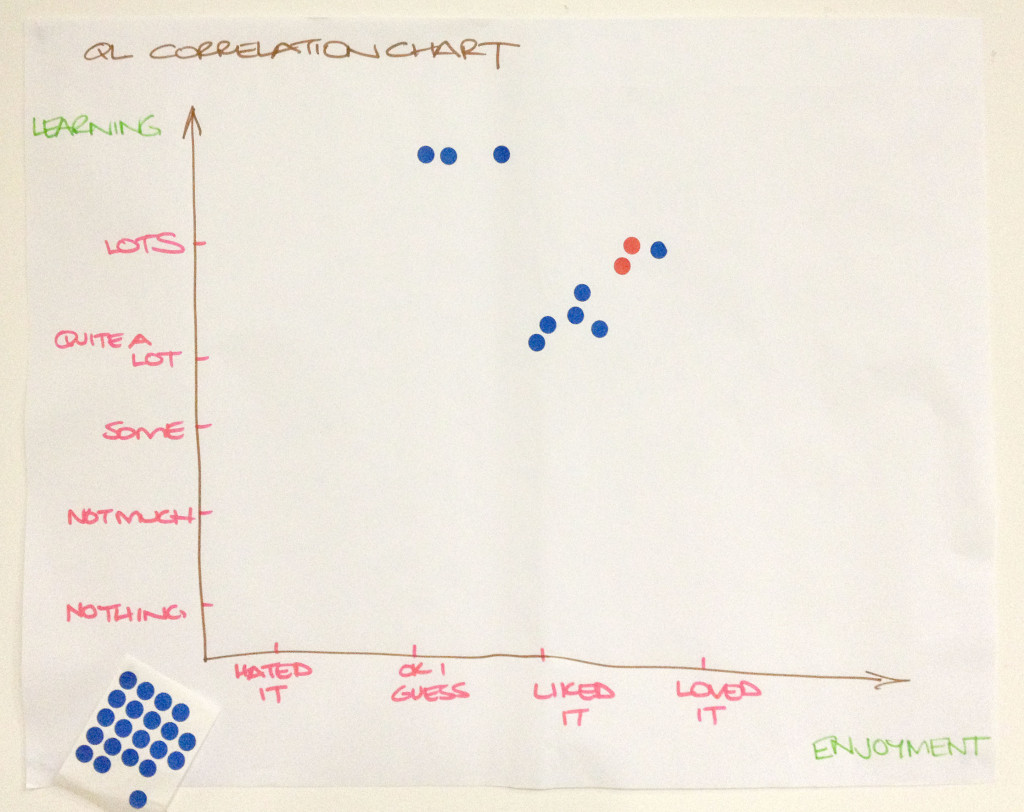
Having determined the questions and scale, the next step is to draw up the correlation chart. It doesn’t have to be typed and printed; hand written charts, such as that shown in Figure 2 work quite well.

Provide a sheet of adhesive dots (or a marker pen). Invite respondents to place a dot in the chart in response to the two questions.
Consider the relationship
What patterns can you see in the data? In Figure 1, you will notice the tendency for individuals’ ratings of learning and enjoyment to be quite similar. Those who reported they enjoyed the seminar more tended to report learning more. In other words, there is a positive correlation between these variables.
Remember, correlation does not mean causation. Correlation only indicates a relationship exists, it doesn’t explain the nature of the relationship. In Australia, for instance, there is a correlation between sales of ice cream cones and shark attacks; nobody suggests one causes the other.
Decide what to do next
Data inform decisions. We collect data to help us decide what to do next. Be sure to consider what the data are suggesting you need to do.
Benefits of a Correlation Chart
A Correlation Chart is easy to use. It can easily be made during a staff or class meeting, with the results instantly visible for everyone to see. It is much easier than a survey!
Everyone can see their own dots on a Correlation Chart; they know their voice is heard and that their opinion matters.
Like many of the Quality Learning tools, a Correlation Chart gives voice to the silent majority while giving perspective to the vocal minority. People see how their perspective relates to those of others in the group.
Keep in mind
A Correlation Chart does not provide any information regarding the reasons for the responses. Take care not to attribute reasons without further investigation.
Respect the anonymity of the respondents. If there are outlier responses – special causes – that are clearly different to those of the majority, don’t seek to identify the individuals concerned. Rather, invite the individual(s) to have a quiet word with you later so you can understand their perspective. There is frequently richness in the views of outliers.
Read more about the Quality Learning Tools.
Learn more about the Quality Learning approach from our book Improving Learning: A how-to guide for school improvement.
Purchase David Langford’s Tool Time for Education book, which explains dozens of tools and how to use them.
