Tag Archives: Learning

A Correlation Chart

There are many Quality Learning tools for gathering the perspectives of groups of people: Consensogram, Parking Lot, Affinity Diagram, Plus/Delta, Fishbone Diagram, Force-field Analysis, to name a few.

Sometimes it’s desirable to gather views on more than one issue, and to examine the relationship between responses to these issues.

A Correlation Chart is useful for examining the relationship between responses.

Correlation Chart

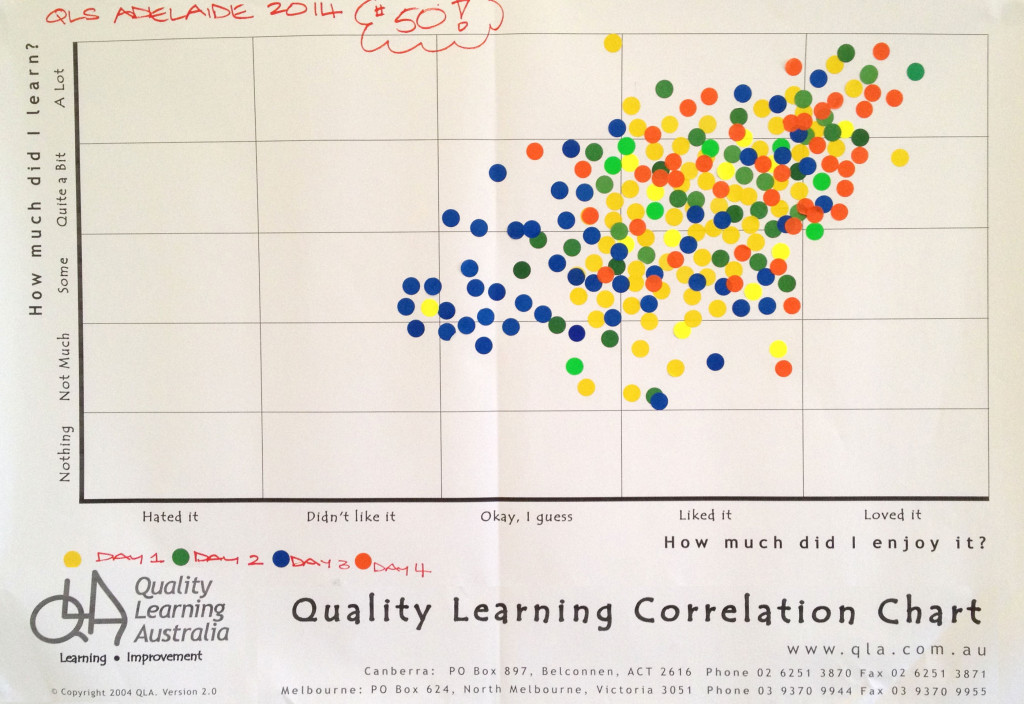
We regularly use a Correlation Chart as a quick and effective way to gather feedback from participants in our workshops. Figure 1 shows a Correlation Chart from a workshop – the 50th four-day Quality Learning Seminar with David Langford held in Australia.
Workshop participant feedback on a Correlation Chart
Figure 1. Workshop participant feedback on a Correlation Chart

Many teachers use a Correlation Chart at the end of a unit of work to gather student feedback on the unit.

Set the questions and scale

The first step when using a Correlation Chart is to decide the questions. The most common question are those shown in Figure 1, namely:

  • How much did you enjoy the workshop/course/unit of work?
  • How much did you learn?

The questions must lend themselves to a scaled response.

Binary questions, which have only two responses such as yes or no, don’t work for a Correlation Chart.

Scales we have seen used effectively include:

  • Frequency: rarely to nearly always
  • Importance: not important to critical
  • Performance: very poor to excellent
  • Amount: nothing to a lot
  • Disposition: hate it to love it
  • Knowledge: never heard of it to mastered it
  • Confidence: not confident to supremely confident.

Whichever scale you choose, respondents will find it helpful if you define ‘anchor points’ along the scale. We typically define five such points. For example, for Frequency:

  • Rarely (10%)
  • Sometimes (25%)
  • Moderately (50%)
  • Mostly (75%)
  • Nearly Always (90%)

Gather and display the data

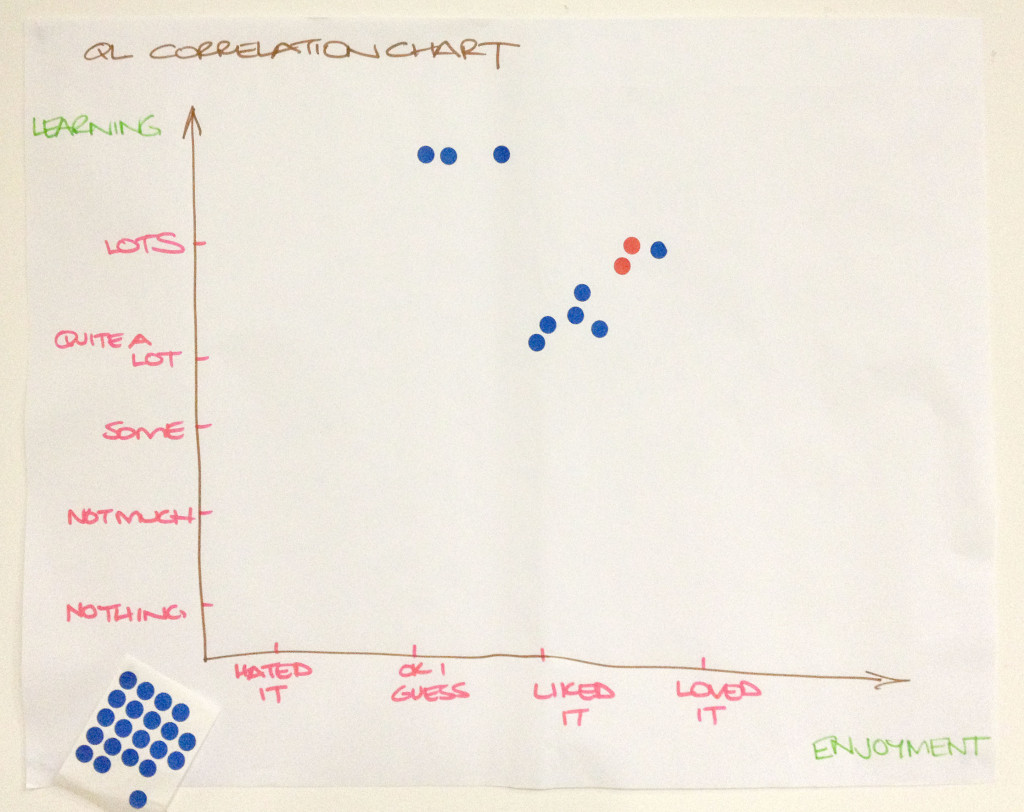
Having determined the questions and scale, the next step is to draw up the correlation chart. It doesn’t have to be typed and printed; hand written charts, such as that shown in Figure 2 work quite well.
A hand-written Correlation Chart
Figure 2. A hand-written Correlation Chart

Provide a sheet of adhesive dots (or a marker pen). Invite respondents to place a dot in the chart in response to the two questions.

Consider the relationship

What patterns can you see in the data? In Figure 1, you will notice the tendency for individuals’ ratings of learning and enjoyment to be quite similar. Those who reported they enjoyed the seminar more tended to report learning more. In other words, there is a positive correlation between these variables.

Remember, correlation does not mean causation. Correlation only indicates a relationship exists, it doesn’t explain the nature of the relationship. In Australia, for instance, there is a correlation between sales of ice cream cones and shark attacks; nobody suggests one causes the other.

Decide what to do next

Data inform decisions. We collect data to help us decide what to do next. Be sure to consider what the data are suggesting you need to do.

Benefits of a Correlation Chart

A Correlation Chart is easy to use. It can easily be made during a staff or class meeting, with the results instantly visible for everyone to see. It is much easier than a survey!

Everyone can see their own dots on a Correlation Chart; they know their voice is heard and that their opinion matters.

Like many of the Quality Learning tools, a Correlation Chart gives voice to the silent majority while giving perspective to the vocal minority. People see how their perspective relates to those of others in the group.

Keep in mind

A Correlation Chart does not provide any information regarding the reasons for the responses. Take care not to attribute reasons without further investigation.

Respect the anonymity of the respondents. If there are outlier responses – special causes – that are clearly different to those of the majority, don’t seek to identify the individuals concerned. Rather, invite the individual(s) to have a quiet word with you later so you can understand their perspective. There is frequently richness in the views of outliers.


Read more about the Quality Learning Tools.

Learn more about the Quality Learning approach from our book Improving Learning: A how-to guide for school improvement.

Purchase David Langford’s Tool Time for Education book, which explains dozens of tools and how to use them.

 

Learning like a guided walk

I recently had the pleasure of completing a guided walk along the Milford Track – one of the Great Walks in New Zealand. The track passes through some of the most beautiful and pristine wilderness in the world.

During the walk, I was reflecting upon the characteristics of the guided walk that made it so pleasurable. Here are my reflections…

A clear path

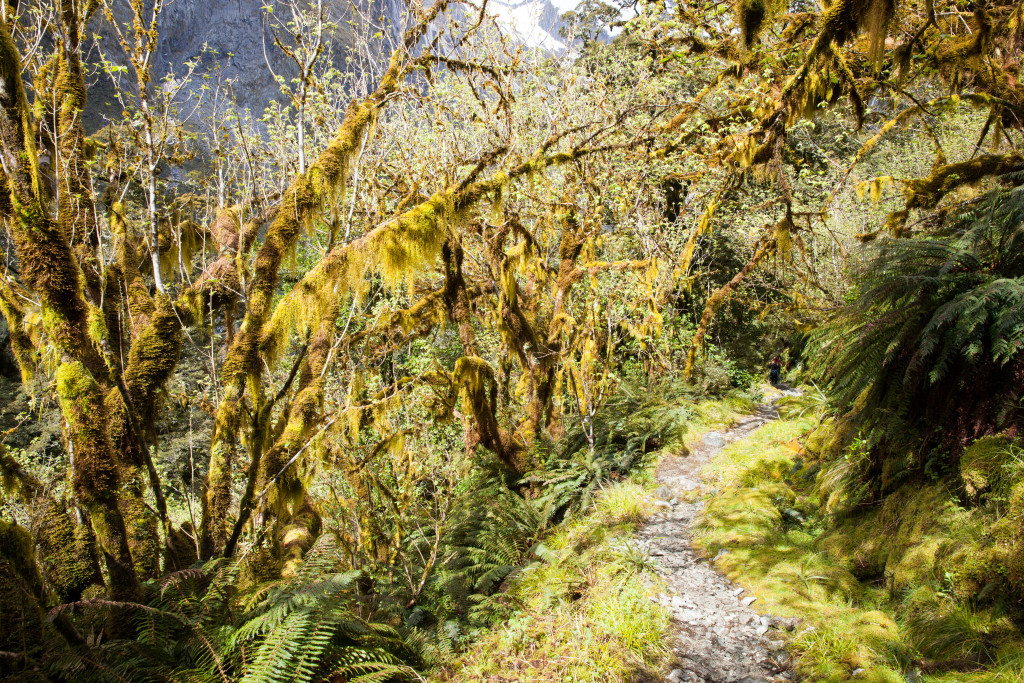
The 33.5 miles of track from Glade Wharf to Sandfly Point is clearly laid out and very well maintained. Throughout the walk it was crystal clear where we were meant to go; if we stuck to the track there was little chance of getting lost.

With signposts

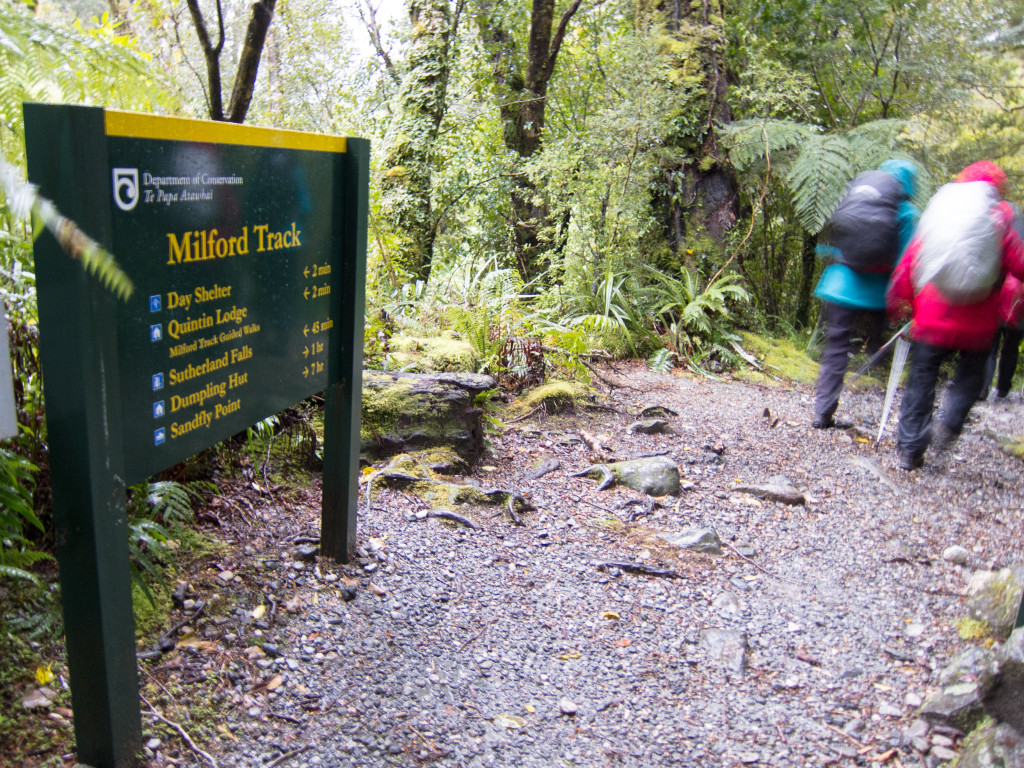
The track is clearly and comprehensively sign-posted. Every mile there is a numbered milepost indicating progress.

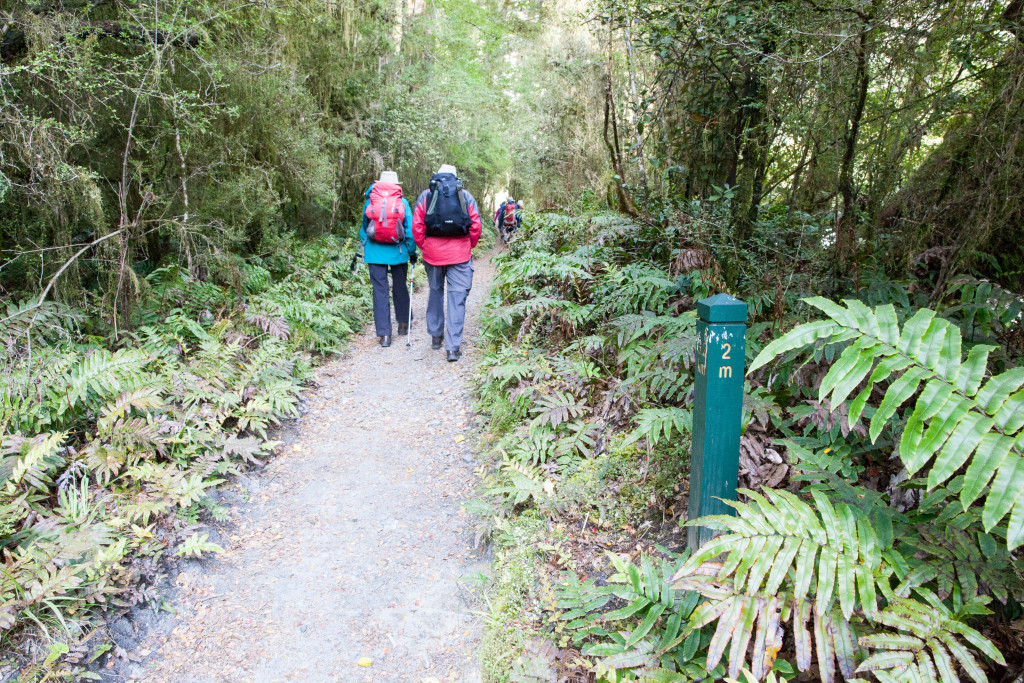
The track is clear, well maintained and there are regular mile posts.
The track is clear, well maintained and there are regular mileposts.

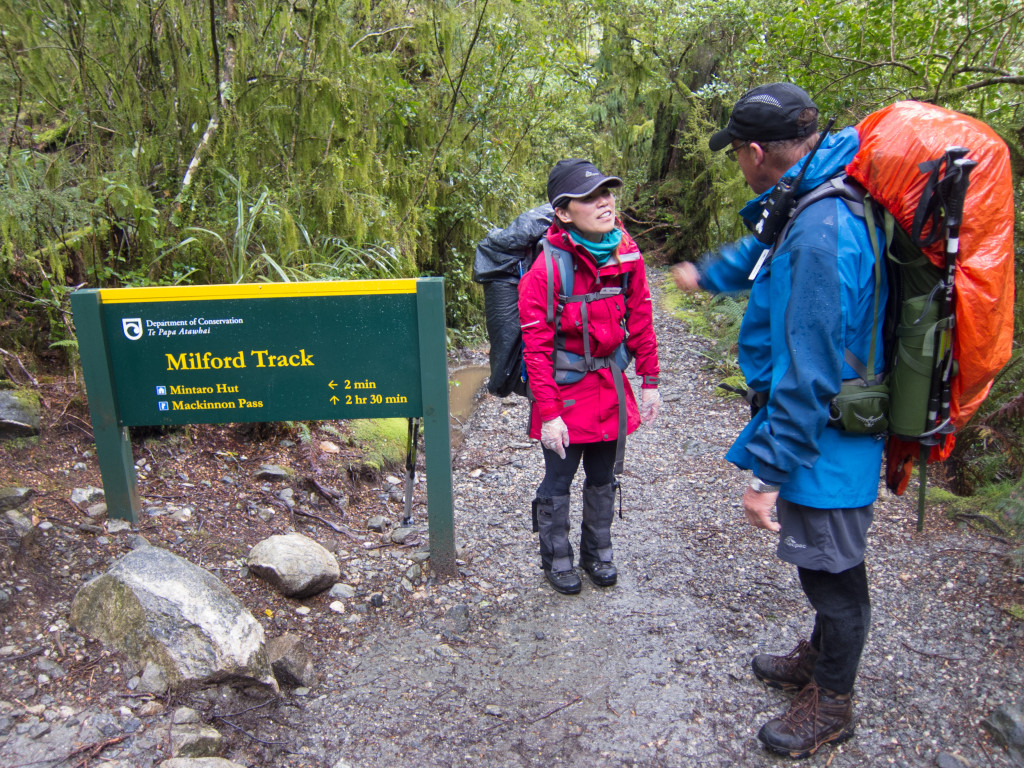
Periodically there are signs indicating distances or estimated times to key landmarks along the route. These signs, along with the mileposts, enabled each of us to track progress and monitor the pace of our walk.

Regular sing-posts enabled us to monitor our progress

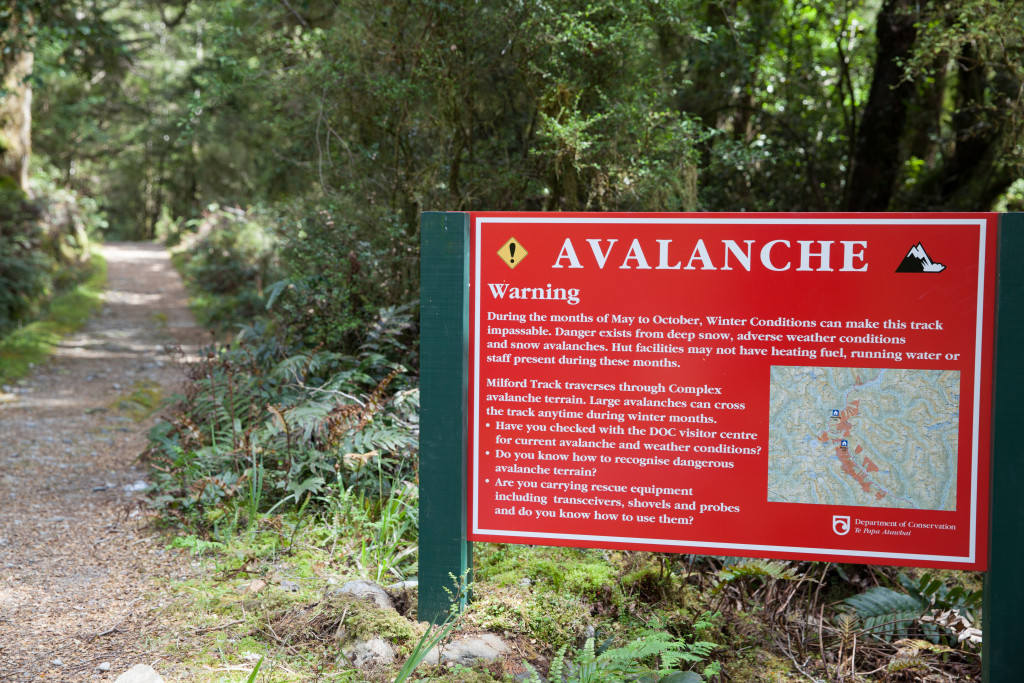
Other signs warn of potential hazards ahead, including areas of possible flooding or avalanche.

Potential hazards are sign-posted

Taken together, these signposts ensured we knew where we were, how far we had come and still had to go, points of interest, and areas where extra care might be required.

Walking at our own pace

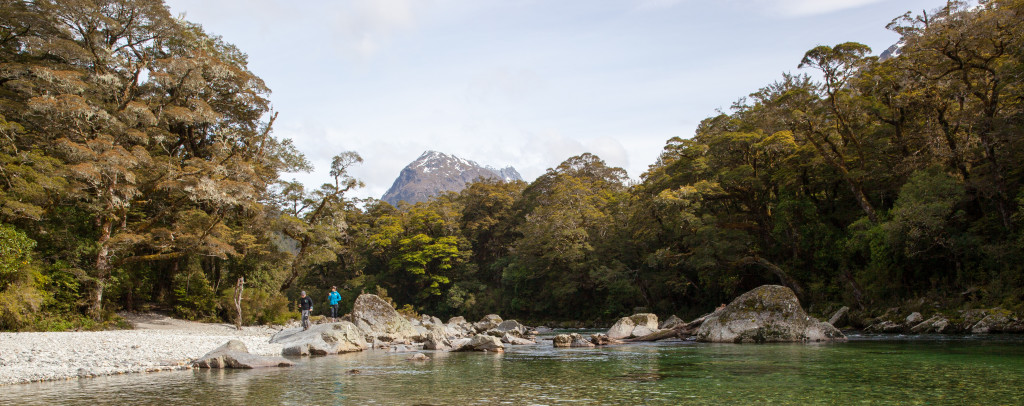
We were encouraged to walk the track at our own pace and to take time to explore the locations we found interesting.

We took time to explore locations of interest to us, this being the Clinton River West Arm

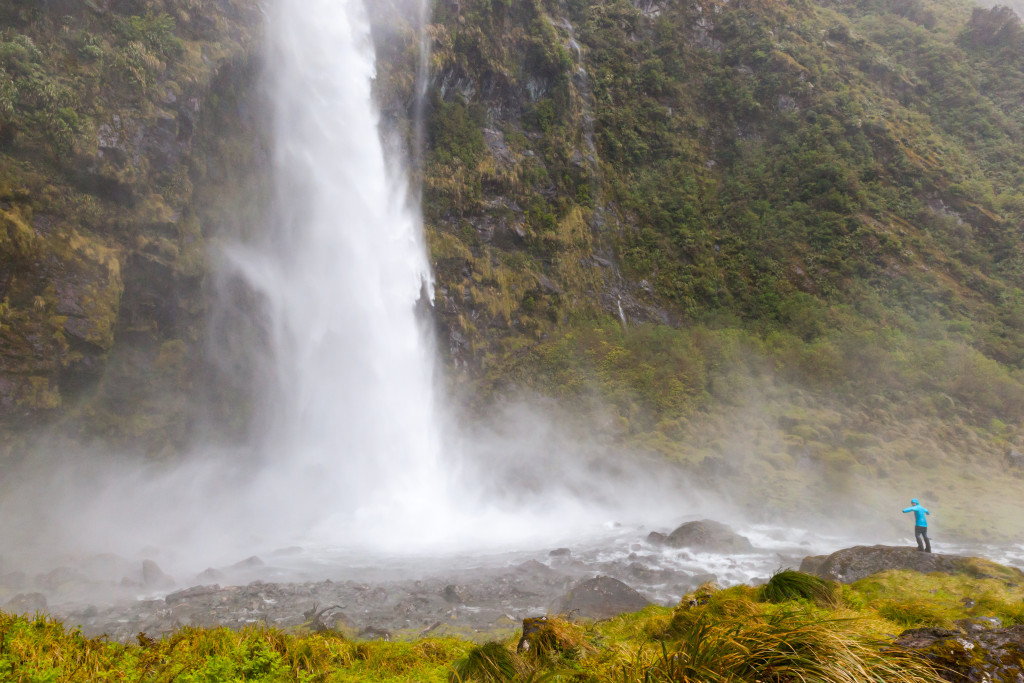
We were also encouraged to explore some of the side tracks that had particular points of interest. This was not compulsory. The side trip to Sutherland Falls, the highest falls in New Zealand, was truly remarkable.

Sutherland Falls, the highest in New Zealand. The water falls 580m.
The base of Sutherland Falls, the highest waterfalls in New Zealand. The water falls 580m.

Walking alone, or with others

In all there were about forty of us completing this walk together.

At times I walked alone. I like to do so; it gives me time to think. There were several occasions where it felt like I was the only person on the track. I could see no-one behind or ahead of me, and I felt I had the place to myself.

At times I felt I had the track all to myself

At other times I walked and chatted with my niece, Helen, who had invited me to do the walk with her.

Occasionally, I walked and chatted with small groups of others, some of whom had travelled across the globe to walk this track.

Everyone was free to choose with whom they walked.

A team of professional guides

A team of four guides accompanied us on the walk. They worked extremely well as a team. I was particularly impressed with the way the acknowledged and drew upon their individual strengths while working together to build their individual and collective capability.

Getting to know us

Each of the guides was friendly and welcoming. They each took time to speak with each of us and get to know a bit about us. They genuinely cared about each walker and were keen to ensure everyone had the best experience possible while under their guidance.

As the walk progressed, they learned about our walking style, preferences and limitations. Which of us were the quick walkers, guaranteed to reach each milestone first? Which of us were likely to find parts of the walk particularly challenging?

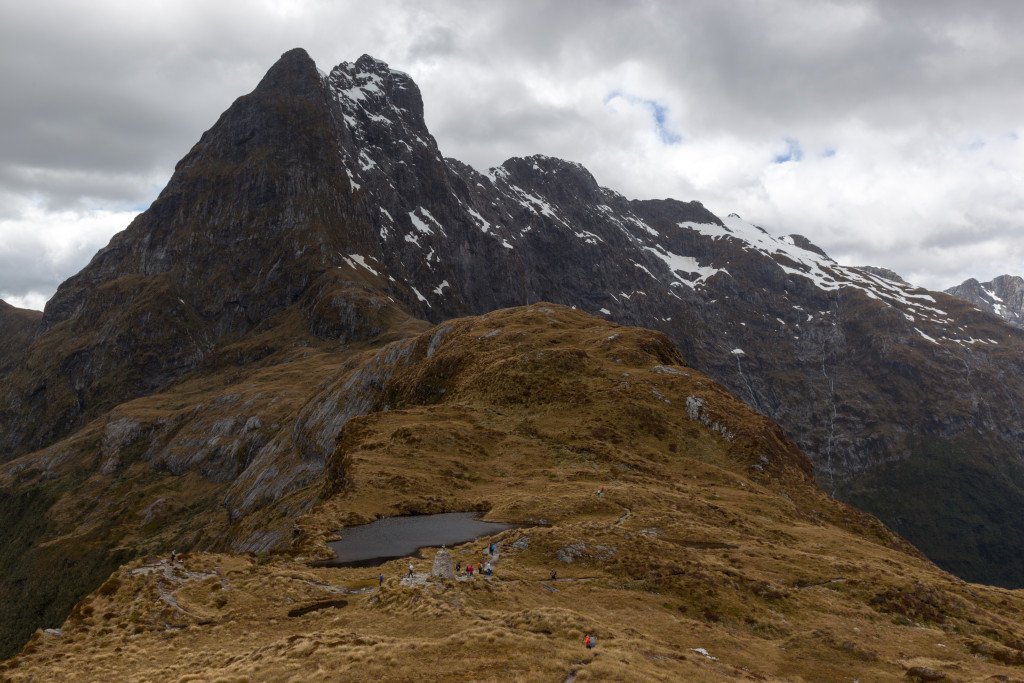
Mackinnon Memorial at Mackinnon Pass.
Mackinnon Memorial at Mackinnon Pass. The climb up and down the pass was challenging for most of us.

Through getting to know us, the guides were able to plan and execute personalised support, where it was required.

Knowing the track

The guides know the track intimately. Collectively they had walked the track many hundreds of times.

The guides highlighted points of interest and significance along the way. They proved very knowledgeable about the flora and fauna, and took the trouble to point out and help us interpret that we were seeing. We were encouraged to be inquisitive and draw upon their knowledge and experience.

Our guides discuss implications of the weather forecast
Two of our guides discuss implications of the latest weather forecast

They also knew how we might respond to the track. They know where the going is easy. They know where it’s most demanding. They know where people may experience difficulty. They also know the hazards and have strategies to minimise the associated risks.

Helping us be prepared

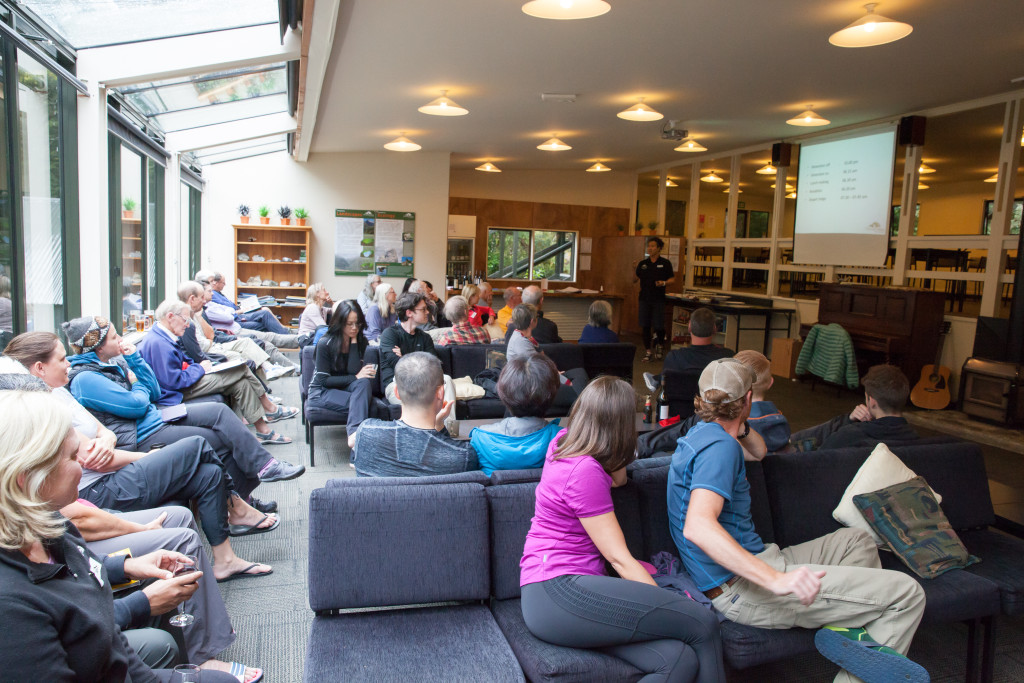
Each evening one of the guides briefed us on the outlook for the following day. The briefing informed us of the terrain ahead, distances involved, weather forecast, points of interest and any potential areas requiring particular care. This enabled us to plan ahead and be prepared to meet the challenges that lay before us.

The briefings also celebrated our achievements that day.

Briefings each evening celebrated our daily achievements and prepared us for the challenges of the following day.

Providing support, as required

At all times there was a guide at the front of the group. This guide checked the path was clear of hazards.

There was also a guide bringing up the rear, ensuring nobody was left behind. This guide provided encouragement and practical support to those walkers finding the terrain a challenge.

The other two guides walked between, within the group. When we encountered a hazard along the track, there was always at least one guide there to help us through safely. This occurred on three occasions: the first when the track was submerged in flood waters and twice where the track had been obliterated by avalanches.

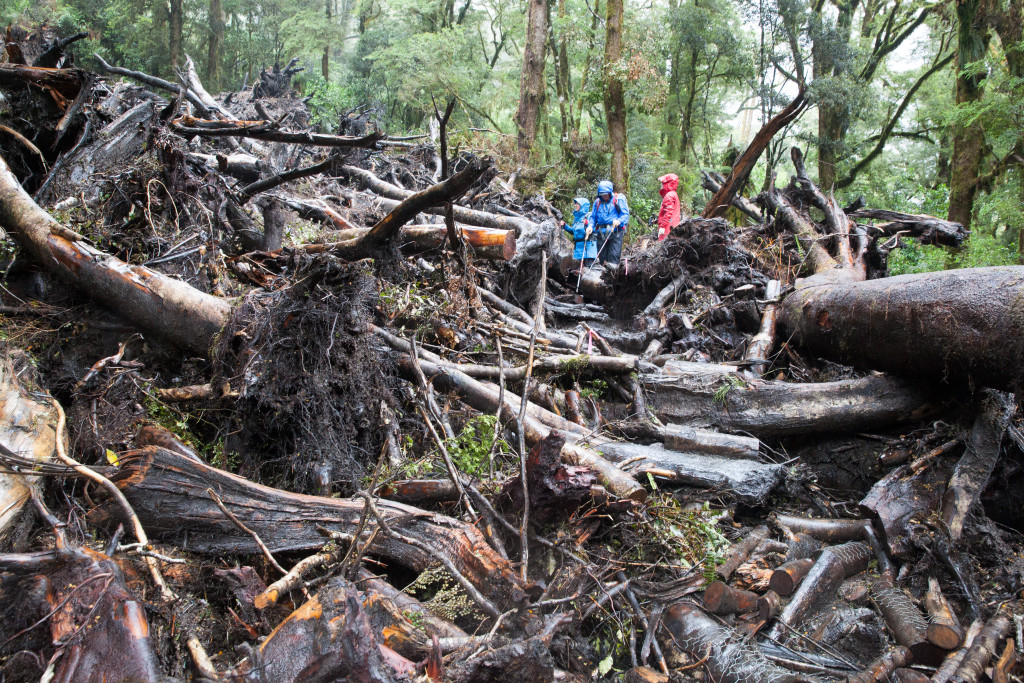
Guides were always on hand to help us though hazardous sections of track, in this case the site of a recent avalanche.

Celebrating Achievement

Having walked more than 33 miles over four days, we arrived at our destination, Milford Sound. Our final briefing was more of a celebration, each of us receiving a certificate during a simple ceremony, then proceeding to enjoy a meal together.

The following morning, we were treated to a brief cruise through the  sound before we each set off on the next stages of our respective journeys.

Dawn on Mitre Peak, Milford Sound

Learning can be like this guided walk

Schooling can be like this guided walk.

A clear path

The curriculum provides the learning path. Tools such as the Capacity Matrix and Gantt Chart put curriculum in the hands of the learners and provide signposts to support learners to plan and monitoring. Areas where special care may be required can also be highlighted.

Learning at their own pace

Once the path is clear, learners can be encouraged to progress at their own pace.

Learners can also take time to explore areas of particular interest to them, adding these to their capacity matrix and recording details of their learning.

Learning alone, or with others

Students can choose when they prefer to work alone, and when they may wish to work with others. Teams and groupings are by choice, not direction.

A team of teachers

Teachers work together as a team: acknowledging each others’ strengths and working to build their individual and collective capability. They are collectively responsible for the safety and progress of the learners.

Teachers take time to get to know the learners under their guidance: the learners’ aspirations, preferences and limitations.

Teachers know the curriculum intimately. They know where it is straightforward and where many students have difficulty. They encourage curiosity, enquiry and exploration.

Teachers  equip learners with skills and tools to plan and be prepared to make the most of the learning opportunities.

Teachers provide personalised support, helping everyone who requires assistance through all sections of the track. They pay particular attention to supporting learners through sections of curriculum that most people find challenging.

Celebrating achievement

Students and teachers acknowledge and celebrate achievements along the way and in ways that are meaningful to everyone.


Read more about Capacity Matrices.

Watch a video showing how year 7 students learn in this way.

Watch a video showing year 10 students learning in this way.

Purchase our book, IMPROVING LEARNING: A how-to guide for school improvement, and read more.