Tag Archives: Creating knowledge

Making school leaders accountable

In this post, we consider how the concepts of accountability, responsibility and authority are being applied in the name of school improvement. We explain why a strong focus on tightening accountability is unlikely to result in improvement in schools (or any other organisations for that matter).

We defined accountability:

Accountability: the collection of outcomes that an individual is charged to produce and for which the individual can be held to account

Note that we defined and discussed accountability, responsibility and authority in detail in the previous post.

An accountability approach to school improvement

The drive to hold educators to account for improving performance has become stronger in recent years. Considerable effort has been expended clarifying the accountabilities and responsibilities of school leaders across many jurisdictions.

Sadly,  tightening accountabilities is unlikely to lead to improved performance.

Here’s why.

Intent

There is one benefit to be derived from clarifying accountabilities and responsibilities. Doing so makes clear what is agreed to be important and how performance will be measured. This focuses attention, which can be beneficial. This is particularly beneficial when the process of agreeing and accepting accountabilities is open and collaborative. For example, team members can agree to take on specific tasks between meetings; each agrees to be accountable to the team for their actions. This can be affirming and effective.

Where organisations take a more formal approach to assigning accountability, it becomes problematic.

Assumptions

The accountability approach to school improvement is based on many questionable assumptions.

Held to account?

What does it mean to be held to account? It can be a requirement to explain what happened, or didn’t happen. It can also mean criticism, blame and punishment. Whatever the meaning, being judged is implicit in the definition.

Routinely passing judgements upon one another is not a feature of highly trusting or collaborative relationships and can be toxic.

Sufficiently comprehensive?

Establishing the specific outcomes for which one will be held to account does focus attention, but this can be at the expense of other areas requiring attention. The approach assumes that all the important outcomes have been identified and codified into accountabilities. This is rarely achieved. The current attempts to hold educators to account for student performance based on standardised testing, for example, is leading some to focus attention on the content to be tested; this can be at the expense of other areas of learning.

It is very difficult to establish an accountability system to address all stakeholders needs.

Numerical goals and targets.

Frequently, accountabilities are expressed as numerical goals or targets, which, it is assumed, can be measured accurately. We discussed in chapter five of our book Improving Learning that numerical goals and targets can lead to distortions of the data and/or the system. Each year the newspapers report cases of teachers and schools ‘cheating’ on high-stakes tests. Unachievable numerical goals may be at the heart of the clean diesel scandal at VW.

As Dr. Deming said, “Fear invites wrong figures.”

Locus of control.

It is assumed that an individual has sufficient control over the activities and results for which they are accountable to ensure the outcomes are met. This is not always the case. A teacher, for example, can have almost no control over the home life of his or her students, which has a very significant impact on the student’s learning.

It hardly seems reasonable to be held accountable for things outside one’s control. 

Stable and capable processes?

The processes in which the individuals work are assumed to be stable and capable. In other words, it is assumed that the processes are predictable and producing desirable results, making achievement of the accountabilities possible. As we highlighted in chapter two of Improving Learning:

Many processes in school education are not capable. 

Motivation?

The approach is based in the assumption that individuals require extrinsic motivation. Motivation has been discussed at length in an earlier series of posts.

Extrinsic motivation factors  focus attention on obtaining the rewards and avoiding the punishments; not on the intrinsic value of the tasks themselves.

Negotiated?

While there is, in theory, scope for negotiation of accountabilities, in practice many are established historically and imposed – top-down. It is the people doing the daily work of the system that best know what needs improving. In particular, they know the barriers to improvement, which can frequently only be addressed by individuals more senior to them.

Top-down imposition of accountabilities may address management’s priorities, but are likely to neglect root causes of waste, frustration and poor performance. 

Interdependence.

Each individual, being held to account for specific outcomes, is based on an assumption of independent relationships within the organisation: each party acts with autonomy towards their own goals.

Relationships in organisations are far more interdependent than autonomous.

Optimisation of the whole.

A system of accountabilities across an organisation may seek to optimise the performance of the organisation as a whole; there is an  assumption that optimising each part of the system will optimise the whole. As we discussed in chapter three of Improving Learning the opposite is true.

By optimising the parts, the whole will be sub-optimised.

On balance, it would appear that focussing on systems to tighten accountabilities holds little promise for delivering improvement. Not only is it difficult to develop and sustain accountability systems within organisations, doing so is based on questionable assumptions. Furthermore, to date, it has demonstrated little systemic improvement.

An alternative

If accountability is not a viable route to improved performance, what should be done instead?

The answer is as simple as it is complex:

Equip everybody so they can work with others to improve the systems of learning for which they are responsible.

The theory and practices are described in detail in our book Improving Learning: A how-to guide for school improvement.

Five Whys – Identifying root causes and motivation

The five whys tool was developed within the Toyota Motor Corporation as a means to identify the underlying causes of problems. When root causes are identified and addressed, the problem can be fixed and stay fixed.

Five whys can also be used to explore personal motivations.

The process is very simple: the issue under investigation is identified and noted. Examples: “Why are students disengaged from their learning”, “Why are we proposing to hold the meeting?”,  “Why are enrolments dropping?”, “Why do we come to school?”, “Why are teachers not listening?”.

“Why?” is then asked five times (the number of repetitions is not immutable, but in most cases five repetitions have been found to be sufficient).

In this example (Figure 1), year 8 students consider why they study mathematics.

Five Whys: Why do we study mathematics?
Figure 1. Five Whys: Why do we study mathematics?

Some years ago a teacher from a secondary school in Victoria told us the following story.

A class was constantly disrupted by the inappropriate behaviour of a student. Instead of responding in the usual manner by removing the child from the classroom, the teacher took the student to one side and applied the five whys tool to investigate the cause of the behaviour.

The student revealed that he found it difficult to make friends with others in the classroom, and that the behaviour was a means of getting attention and connecting with others.

The teacher worked to help the student learn strategies to develop relationships with others. This was a far more productive and longlasting solution than would have been achieved by reacting to the symptom and removing the student from the classroom.


Watch a video clip of a year 2 student explore why they come to school.

Watch a video clip of a year 4 student exploring the reasons her class comes to school.

Watch a case study video from a year 8 english class that includes the use of Five Whys to explore ‘Why do we study English’?

Purchase Tool Time for Education, which provides details of many improvement tools for schools and classrooms.

Read more about the quality improvement approach in our book IMPROVING LEARNING: A how-to guide for school improvement. 
Learning like a guided walk

I recently had the pleasure of completing a guided walk along the Milford Track – one of the Great Walks in New Zealand. The track passes through some of the most beautiful and pristine wilderness in the world.

During the walk, I was reflecting upon the characteristics of the guided walk that made it so pleasurable. Here are my reflections…

A clear path

The 33.5 miles of track from Glade Wharf to Sandfly Point is clearly laid out and very well maintained. Throughout the walk it was crystal clear where we were meant to go; if we stuck to the track there was little chance of getting lost.

With signposts

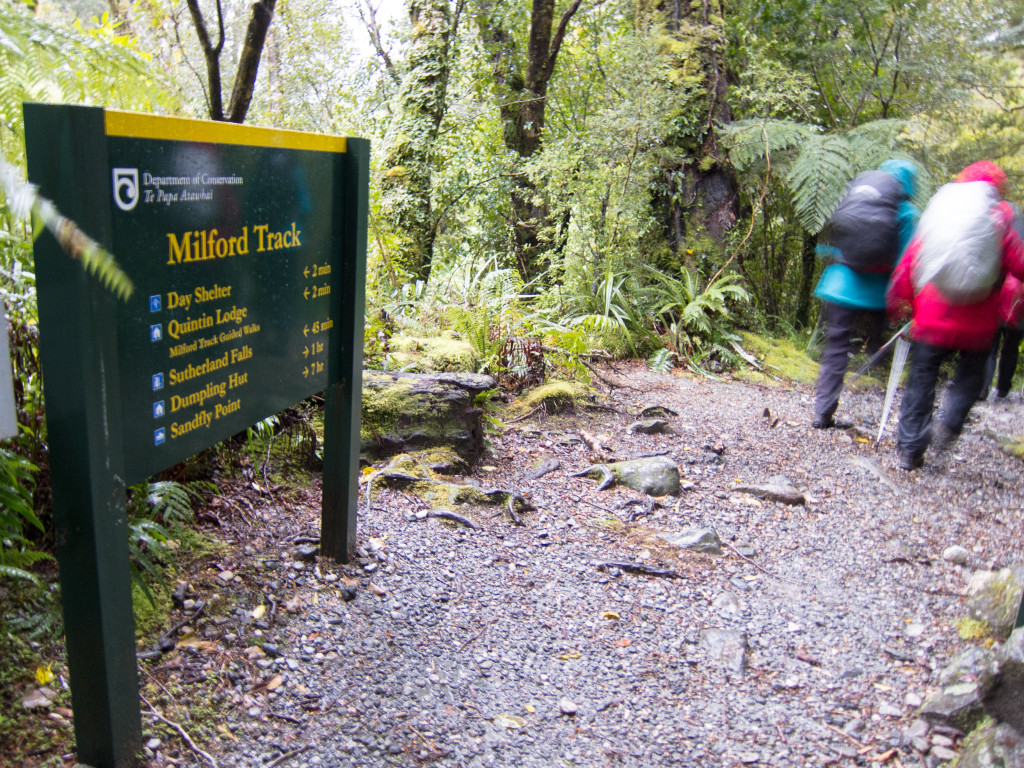
The track is clearly and comprehensively sign-posted. Every mile there is a numbered milepost indicating progress.

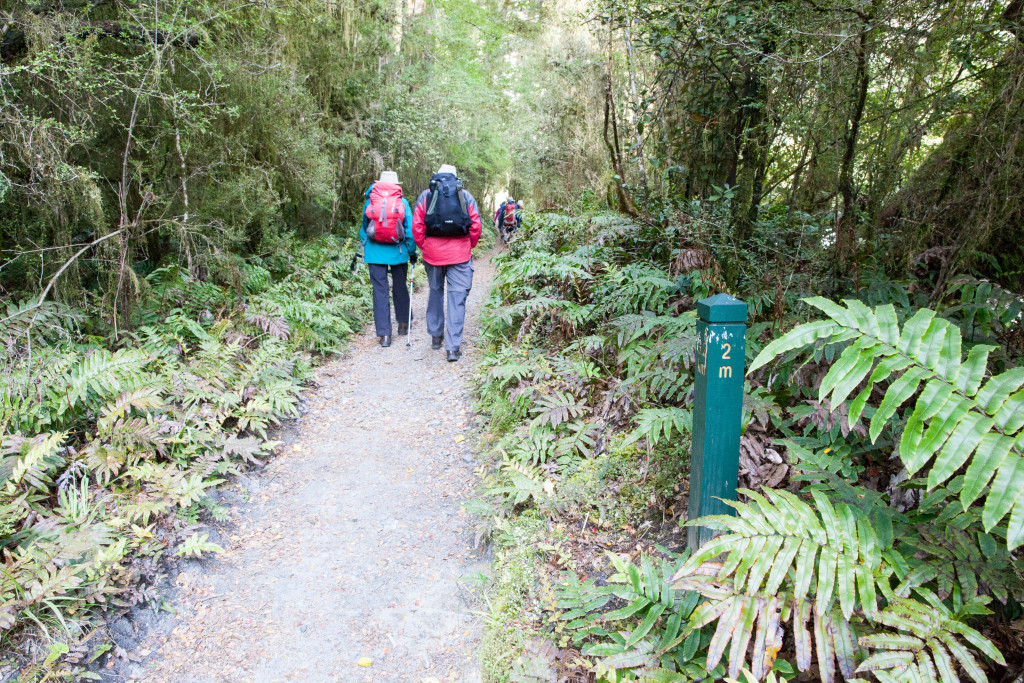
The track is clear, well maintained and there are regular mile posts.
The track is clear, well maintained and there are regular mileposts.

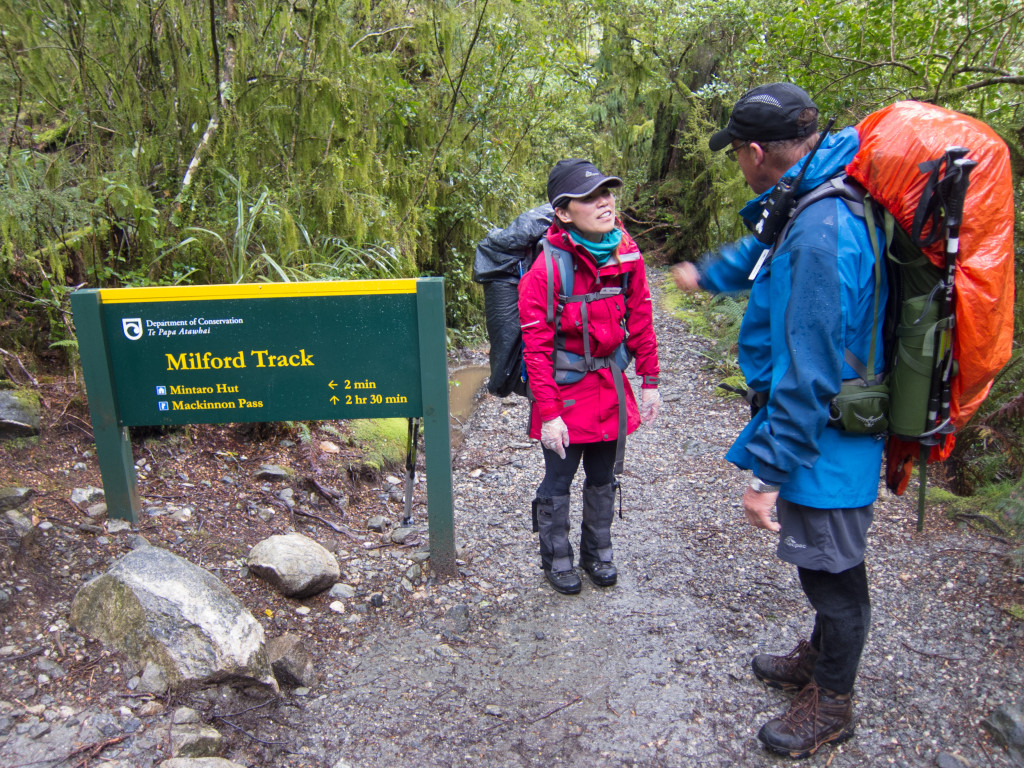
Periodically there are signs indicating distances or estimated times to key landmarks along the route. These signs, along with the mileposts, enabled each of us to track progress and monitor the pace of our walk.

Regular sing-posts enabled us to monitor our progress

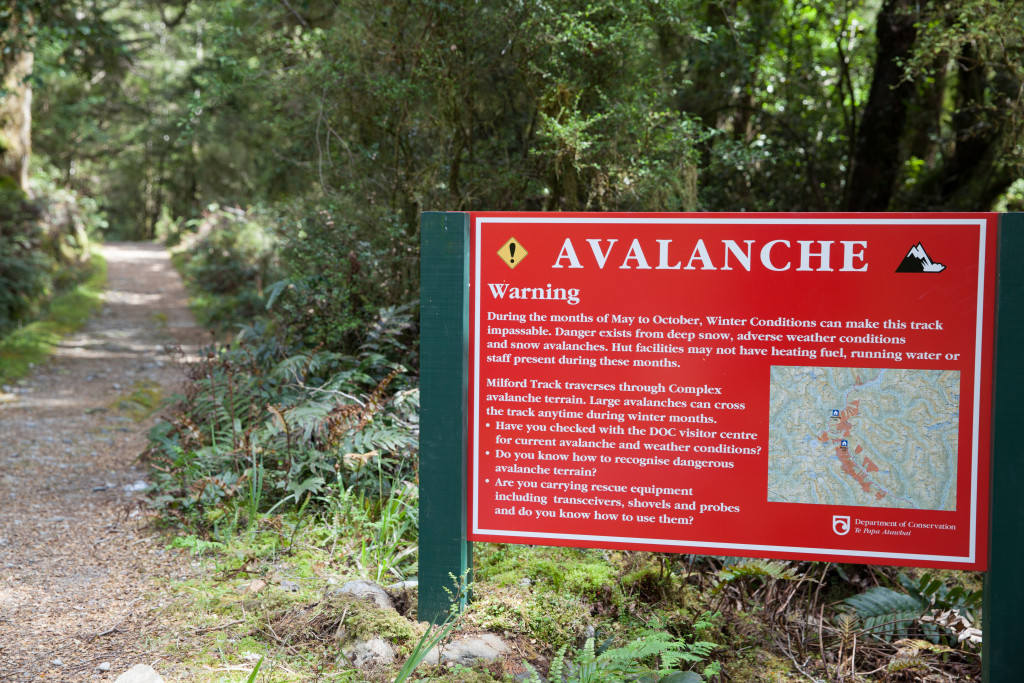
Other signs warn of potential hazards ahead, including areas of possible flooding or avalanche.

Potential hazards are sign-posted

Taken together, these signposts ensured we knew where we were, how far we had come and still had to go, points of interest, and areas where extra care might be required.

Walking at our own pace

We were encouraged to walk the track at our own pace and to take time to explore the locations we found interesting.

We took time to explore locations of interest to us, this being the Clinton River West Arm

We were also encouraged to explore some of the side tracks that had particular points of interest. This was not compulsory. The side trip to Sutherland Falls, the highest falls in New Zealand, was truly remarkable.

Sutherland Falls, the highest in New Zealand. The water falls 580m.
The base of Sutherland Falls, the highest waterfalls in New Zealand. The water falls 580m.

Walking alone, or with others

In all there were about forty of us completing this walk together.

At times I walked alone. I like to do so; it gives me time to think. There were several occasions where it felt like I was the only person on the track. I could see no-one behind or ahead of me, and I felt I had the place to myself.

At times I felt I had the track all to myself

At other times I walked and chatted with my niece, Helen, who had invited me to do the walk with her.

Occasionally, I walked and chatted with small groups of others, some of whom had travelled across the globe to walk this track.

Everyone was free to choose with whom they walked.

A team of professional guides

A team of four guides accompanied us on the walk. They worked extremely well as a team. I was particularly impressed with the way the acknowledged and drew upon their individual strengths while working together to build their individual and collective capability.

Getting to know us

Each of the guides was friendly and welcoming. They each took time to speak with each of us and get to know a bit about us. They genuinely cared about each walker and were keen to ensure everyone had the best experience possible while under their guidance.

As the walk progressed, they learned about our walking style, preferences and limitations. Which of us were the quick walkers, guaranteed to reach each milestone first? Which of us were likely to find parts of the walk particularly challenging?

Mackinnon Memorial at Mackinnon Pass.
Mackinnon Memorial at Mackinnon Pass. The climb up and down the pass was challenging for most of us.

Through getting to know us, the guides were able to plan and execute personalised support, where it was required.

Knowing the track

The guides know the track intimately. Collectively they had walked the track many hundreds of times.

The guides highlighted points of interest and significance along the way. They proved very knowledgeable about the flora and fauna, and took the trouble to point out and help us interpret that we were seeing. We were encouraged to be inquisitive and draw upon their knowledge and experience.

Our guides discuss implications of the weather forecast
Two of our guides discuss implications of the latest weather forecast

They also knew how we might respond to the track. They know where the going is easy. They know where it’s most demanding. They know where people may experience difficulty. They also know the hazards and have strategies to minimise the associated risks.

Helping us be prepared

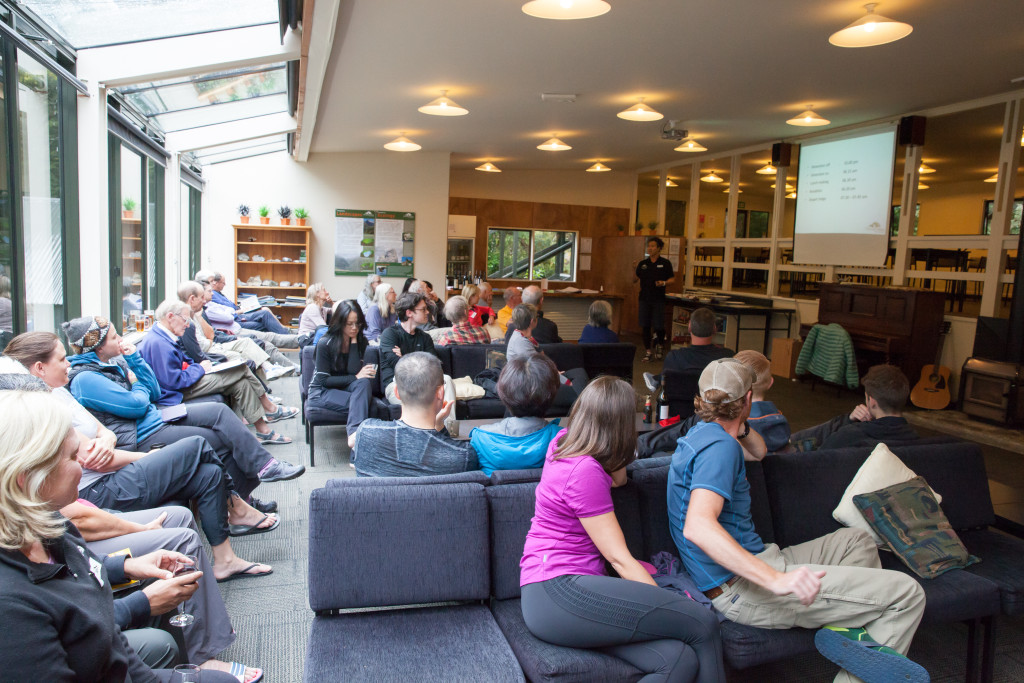
Each evening one of the guides briefed us on the outlook for the following day. The briefing informed us of the terrain ahead, distances involved, weather forecast, points of interest and any potential areas requiring particular care. This enabled us to plan ahead and be prepared to meet the challenges that lay before us.

The briefings also celebrated our achievements that day.

Briefings each evening celebrated our daily achievements and prepared us for the challenges of the following day.

Providing support, as required

At all times there was a guide at the front of the group. This guide checked the path was clear of hazards.

There was also a guide bringing up the rear, ensuring nobody was left behind. This guide provided encouragement and practical support to those walkers finding the terrain a challenge.

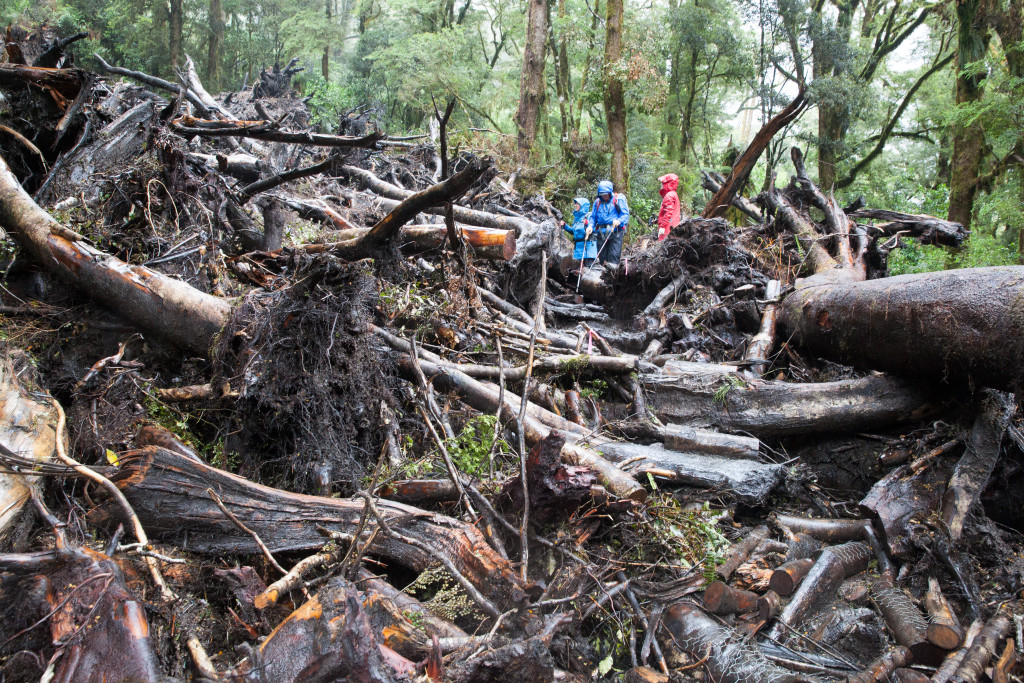
The other two guides walked between, within the group. When we encountered a hazard along the track, there was always at least one guide there to help us through safely. This occurred on three occasions: the first when the track was submerged in flood waters and twice where the track had been obliterated by avalanches.

Guides were always on hand to help us though hazardous sections of track, in this case the site of a recent avalanche.

Celebrating Achievement

Having walked more than 33 miles over four days, we arrived at our destination, Milford Sound. Our final briefing was more of a celebration, each of us receiving a certificate during a simple ceremony, then proceeding to enjoy a meal together.

The following morning, we were treated to a brief cruise through the  sound before we each set off on the next stages of our respective journeys.

Dawn on Mitre Peak, Milford Sound

Learning can be like this guided walk

Schooling can be like this guided walk.

A clear path

The curriculum provides the learning path. Tools such as the Capacity Matrix and Gantt Chart put curriculum in the hands of the learners and provide signposts to support learners to plan and monitoring. Areas where special care may be required can also be highlighted.

Learning at their own pace

Once the path is clear, learners can be encouraged to progress at their own pace.

Learners can also take time to explore areas of particular interest to them, adding these to their capacity matrix and recording details of their learning.

Learning alone, or with others

Students can choose when they prefer to work alone, and when they may wish to work with others. Teams and groupings are by choice, not direction.

A team of teachers

Teachers work together as a team: acknowledging each others’ strengths and working to build their individual and collective capability. They are collectively responsible for the safety and progress of the learners.

Teachers take time to get to know the learners under their guidance: the learners’ aspirations, preferences and limitations.

Teachers know the curriculum intimately. They know where it is straightforward and where many students have difficulty. They encourage curiosity, enquiry and exploration.

Teachers  equip learners with skills and tools to plan and be prepared to make the most of the learning opportunities.

Teachers provide personalised support, helping everyone who requires assistance through all sections of the track. They pay particular attention to supporting learners through sections of curriculum that most people find challenging.

Celebrating achievement

Students and teachers acknowledge and celebrate achievements along the way and in ways that are meaningful to everyone.


Read more about Capacity Matrices.

Watch a video showing how year 7 students learn in this way.

Watch a video showing year 10 students learning in this way.

Purchase our book, IMPROVING LEARNING: A how-to guide for school improvement, and read more.

PE, PDSA and Student Voice

We have previously discussed the power of the Plan-Do-Study-Act (PDSA) cycle in bringing about collaborative, sustainable improvement. We have also emphasised the importance of allowing students to play a key role – giving students a ‘real voice’ – in improving their school and classroom. In this blog, we share another example. This time, how the PDSA process was used by a teacher and students to improve learning and engagement in their physical education (PE) classroom. (You can also view this as a QLA case study video.)

Chris, PE Teacher
Teacher, Chris, with her PE class PDSA storyboard

Chris is a leading specialist teacher at a Victorian primary school. She observed the school’s Year 6 students becoming increasingly disengaged during their weekly PE lessons. PE teachers were stressed and student behaviour was worsening. No one was enjoying PE!

Chris decided it was time to set students and teachers to work to improve PE by applying the PDSA cycle.

As we have seen previously:

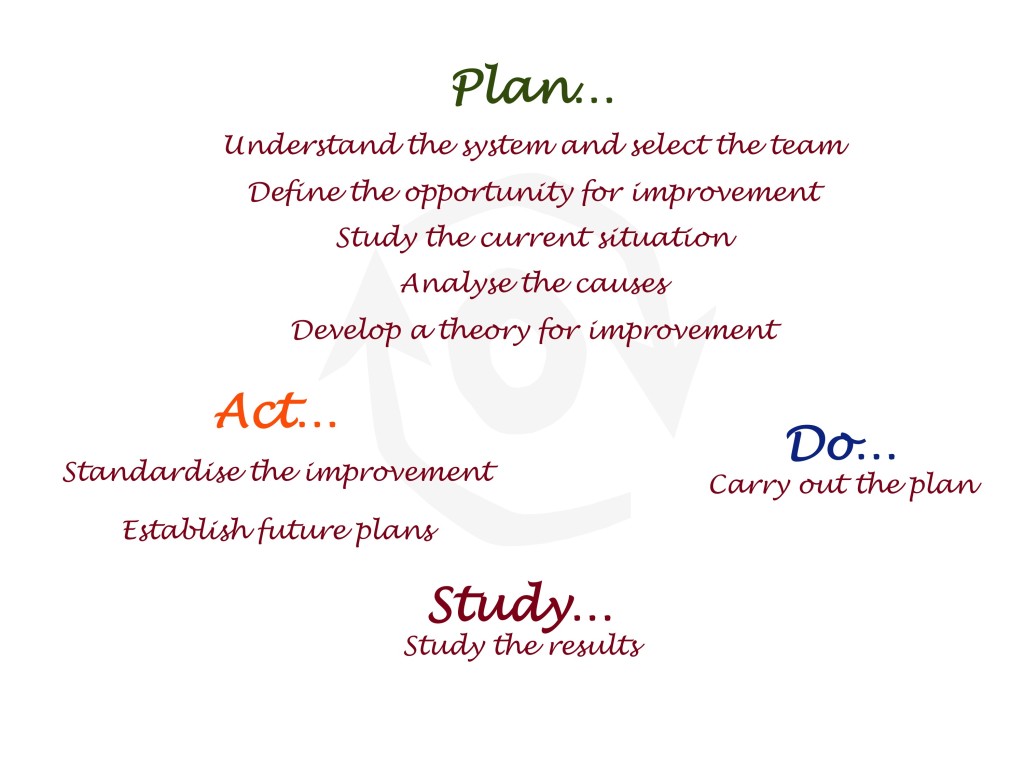
PDSA is a highly effective improvement approach, based upon a cycle of theory, prediction, observation, and reflection.

It involves applying a structured process to achieve sustainable improvement.

A nine step PDSA process

This includes:

  • defining the opportunity for improvement by agreeing the purpose and establishing a shared vision of excellence
  • focusing improvement efforts on a system or process (rather than blaming individuals)
  • identifying root causes not symptoms
  • developing and applying a theory for improvement
  • reflecting on the outcomes achieved to agree a new ‘best method’ or further improvement needed.

Here’s how…

Chris applied the PDSA process with her students. They documented a comprehensive storyboard to capture their agreements, the data collected, and to reflect their progress in applying the PDSA process.

Here’s what they did:

  1. Students and teachers discussed to agree the opportunity for improvement – to improve their PE classes.
  2. They studied the current situation – what did PE currently look like, feel like, and what was going on? They agreed: students were disengaged, disinterested and not putting in their best efforts; some students were disrupting the class, preventing others from enjoying PE; and teachers were frustrated.

    CSV014f RHPS PDSA PE.00_00_54_14.Still001
    PDSA storyboard extract: brainstorm of the current situation in PE
  3. They collected data to measure the extent of the dissatisfaction with PE. A correlation chart was used to measure student
    CSV014f RHPS PDSA PE.00_01_30_08.Still002
    PDSA storyboard extract: collecting data using a correlation chart – how much are students enjoying and learning in PE?

    perception. The data revealed low levels of student enjoyment
    (fun) and learning in the PE classroom.

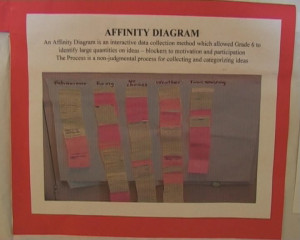
  4. Students then brainstormed and themed the drivers and barriers associated with motivation and participation in their PE classroom. They used sticky notes and an affinity diagram to facilitate this. The major barriers they identified were: ‘inappropriate behaviour’, ‘boring classes’, ‘lack of student choice’, ‘the weather’ and ‘wasting time’.

    CSV014f RHPS PDSA PE.00_01_43_07.Still003
    PDSA storyboard extract: affinity diagram of the barriers to student motivation and participation in PE
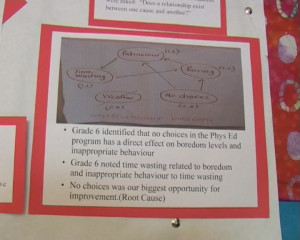
  5. These barriers were analysed to agree the root causes using an interrelationship digraph. (They knew that by working on the root causes of their problem that they would realise the greatest return on their improvement efforts.) For the PE students this revealed ‘lack of choice’ as the major or root cause. A lack of choice by students in their PE lessons was seen as a major barrier to participation and motivation. It was impacting upon the other causes and driving the observed problems with behaviour and performance in their classroom.

    CSV014f RHPS PDSA PE.00_02_21_16.Still004
    PDSA storyboard extract: interrelationship digraph analysing the root causes of a lack of student motivation and participation in PE
  6. A bone diagram was used with students to further explore the current situation, and to agree a vision of excellence for PE – what they wanted PE to be like. The resulting student vision showed students believed: student choice, a clear purpose and process for each session, appropriate behaviour, more minor games, a mix of skills, effective use of time, student’s understanding what was expected, and knowing whether they were improving; were the key characteristics students believed were essential for a great PE lesson.

    CSV014f RHPS PDSA PE.00_02_50_14.Still005
    PDSA storyboard extract: bone diagram agreeing a vision of excellence for PE
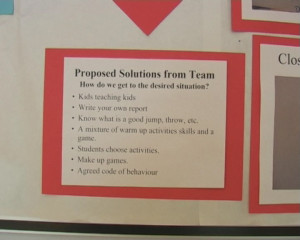
  7. They brainstormed possible solutions which included: ‘kids teaching kids’,  students ‘choosing activities’ and ‘writing their own report’,   agreeing a student ‘code of behaviour’, clarifying expectations (quality criteria: ‘know what a good throw, jump looks like’), and students ‘making up games’.

    CSV014f RHPS PDSA PE.00_03_29_13.Still007
    PDSA storyboard extract: brainstorm of possible solutions to improve PE
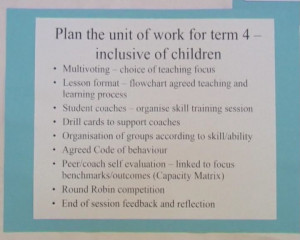
  8. These solutions helped them to develop a ‘theory for improvement’ comprising the following key strategies:
  • multi-voting to agree the focus of each lesson
  • agreeing the lesson format – flowcharting the teaching and learning process
  • appointing student skill coaches and documenting skill cards to help the coaches do their job
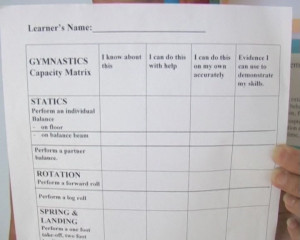
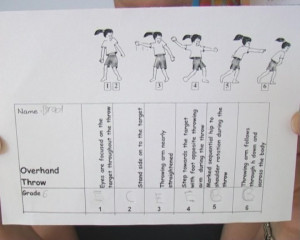
  • students undertaking peer evaluation together with their teacher/coach. They developed capacity matrices for key areas of learning to help them to do this. They also documented quality criteria describing how to execute essential skills with a high degree of excellence (e.g. how to do an overhand throw). Students used the capacity matrices and quality criteria as the basis for reflection and evaluating their progress in PE
  • agreeing a code of behaviour
  • everyone reflecting and giving feedback after each lesson.
CSV014f RHPS PDSA PE.00_03_46_16.Still008
PDSA storyboard extract: agreed strategies to improve PE
CSV014f RHPS PDSA PE.00_04_32_02.Still010
PE – capacity matrix for gymnastics
CSV014f RHPS PDSA PE.00_04_48_15.Still012
PE – quality criteria for an overhand throw

The outcome?

The PE classes applied the agreed strategies and new processes, and a few weeks later reflected on the effectiveness of the improvements they had made (the ‘study’ phase of the PDSA
process).

  • Behaviour and engagement improved. Students were motivated and learning
  • Students ‘owned’ and were running the PE lessons with minimal guidance from PE teachers! They were responsible for their learning
  • PE lessons had a productive ’buzz’! Students were excited. Teachers were happy.

The processes they had developed together were adopted as the new way for PE lessons.

Chris described the PDSA based collaborative process as having an amazing impact.

Applying the PDSA process, working ‘with the kids’ and not  ‘doing to the kids’,  brought about significant positive change to PE lessons – improving the way teachers were teaching and students were learning – to great effect!

Learn more…

Download the detailed 9-step PDSA poster.

Purchase IMPROVING LEARNING: A how-to guide for schools, to learn more about the quality improvement philosophy and methods.

Purchase our learning and improvement guide: PDSA Improvement Cycle.

Watch a video of PDSA applied to year one writing.

Watch a video of PDSA applied within a multi-age primary classroom.

Watch a video about student teams applying PDSA to school improvement.

What is your school’s learning theory?

What is your school’s theory of teaching and  learning?

Some schools waste time focusing their efforts on trying to control and manage the actions and behaviours of individuals. They would do better examining the underpinning theory, systems and processes driving the action and behaviour. Reflecting deeply on, and defining (making explicit), the beliefs upon which current approaches to learning and teaching are based, can lead to great focus, alignment and return on efforts to improve.

Fundamental to improving learning is to agree (define) the theory guiding our teaching and learning.

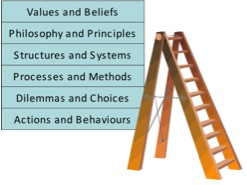
The following anthropological model adapted from the work of Martin Weisbord can help us understand why this is so. It describes a hierarchy of influences on organisational behaviour. The model is consistent with Deming’s teachings on how systems drive performance and behaviour, and the need to develop theory to drive improvement.

Weisbords Ladder
Weisbord’s anthropological model illustrating an organisational heirachy of theory driving action and behaviour

Weisbord’s model illustrates the relationship between beliefs, philosophy (theory), systems, processes, choices and action. An organisation’s systems and processes reflect and reinforce its values, beliefs and philosophy. These systems and structures dictate the processes and methods, and shape the dilemmas and choices faced by individuals of the organisation. The choices made by individuals, in turn, produce the actions and behaviours we observe.

Let’s look at an example to illustrate. Say we believe students are inherently lazy, that they have little desire to improve, and need to be motivated to learn. We will then develop systems and processes in our school and classrooms in an attempt to extrinsically motivate them. Our systems and processes will usually be based upon incentives and rewards, fear and punishment. If, however we believe we are born with an innate desire to learn and to better ourselves, and that the motivation to learn comes from within, then we will design very different systems of learning in our classrooms. These systems usually focus upon building ownership of learning, and working with students to identify and remove the barriers to their intrinsic motivation and learning.

Defining a theory and designing systems and processes can be a deliberate and thoughtful action or it can occur through natural evolution – the choice is ours.

We can make a conscious choice to define and make explicit our values and beliefs regarding teaching and learning.  An operational definition is used to achieve and document a shared understanding of the precise meaning of concept/s. Operational definitions provide clarity to groups of individuals for the purposes of discussion and action.

It follows that once we have defined our theory of teaching and learning, we can design structures, systems, processes and methods that are aligned to it and naturally promote the actions and behaviours we desire.

Of course, we draw upon evidence-based research to craft our theory. We can then work together over time testing, reinforming and reaffirming this theory, and improving systems and processes to produce the performance and behavioural outcomes we wish to see.

How to…

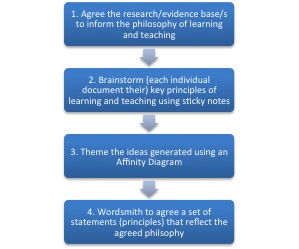
Our work with schools in defining a learning and teaching philosophy has typically followed the process summarised in the flowchart below. All staff are invited to be involved in agreeing the philosophy which takes place through one or more workshops.

Developing a Learning Theory Flowchart
Flowchart of a process to create a school learning theory

Step 1.  Agree a research or evidence-base to inform the philosophy

The first step is to agree and draw upon a research or evidence-base to inform the philosophy. Education systems in Australia have, over time, adopted different pedagogical models. Schools have adopted many different models, all purporting to reflect the latest research and providing the theory necessary to guide excellent teaching practice. The Quality Teaching model, the National School Improvement Tool, the e5 Instructional Model, and the International Baccalaureate are examples of pedagogical models currently in use. Explore the preferred model/s with all staff before defining your philosophy to agree which one or more resonate and align with the needs of your learning community. Of course, if there is a model that adequately describes the philosophy to teaching and learning that your school community wishes to adopt, the job is made easier. Job done – just agree to use it!

Step 2.  Brainstorm ideas

Something we tend to overlook is to recognise the ‘prior knowledge’ of our teachers. Every educator will have developed a theory – based upon their understanding and experience – as to the greatest influences on learning in their classroom. Ask staff also to reflect upon their own teaching and learning values and beliefs. We have found it helpful to express the learning and teaching philosophy as a set of (documented) principles.

To define the philosophy, ask staff to brainstorm their key learning and teaching beliefs, concepts and principles. This can be achieved by every staff member providing their input to the process by writing down their individual ideas as statements on sticky notes – one statement per sticky note.

Step 3.  Collate the ideas using an Affinity Diagram

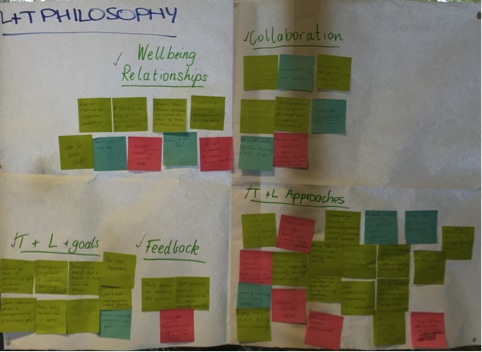
The staff input can then be collated by creating an Affinity Diagram with the sticky notes. Headings are applied to the Affinity Diagram reflecting the agreed major themes (as in the figure below).

Learning Theory Affinity Diagram
Affinity Diagram – theming ideas for a learning theory

Step 4.  Agree theory statements

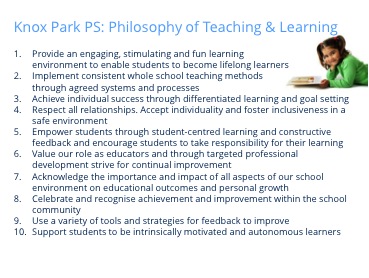
These themes can be documented as a set of agreed statements (principles). For example, the following are the principles of learning and teaching agreed to by Knox Primary School in Melbourne, Victoria.

Knox Park Primary School, Victoria Learning and Teaching Philosophy

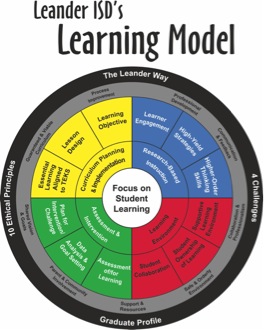
Here is another example of an agreed learning and teaching philosophy. It is the Learning Model developed by the Leander Independent Schools District in Texas, USA.

LISD Learning Model
Leander Independent Schools District, Texas, USA Learning Model

The theory as a foundation for continual improvement

The school’s theory of learning and teaching, or principles, are then used as an ongoing reference to develop, review and continually improve consistency in policy and practice across the school. Each principle is subject to ongoing exploration through reflection and dialogue to develop deeper and shared understanding, and to inform the development of agreed learning systems and processes – the school’s pedagogical framework.

Naturally, the philosophy is dynamic. Like any theory or hypothesis, to be relevant and effective in an ongoing way, it will need to be regularly reviewed, reaffirmed or reinformed by further research and our experiences of applying it over time.

A final note

John Hattie’s research (Teachers Make a Difference: What is the research evidence? Australian Council for Educational Research, October 2003) revealed greater variation between the classrooms in an Australian school than between Australian schools. Defining the theory that will guide teaching and learning across your school is a way to reduce this variation.

To learn more…

Purchase a copy of Improving Learning: a how to guide to school improvement.

How to gauge consensus – use a Consensogram

Quality learning provides administrators, educators, and students with the thinking and practical quality improvement tools necessary to continually improve schools, classrooms and learning. The Consensogram is one of these powerful and easy-to-use quality improvement tools.

Image of a consensogram
A consensogram

The Consensogram facilitates collaboration to support planning and decision making through the collection and display of data. It can be used to gain important insights into the perceptions of stakeholders (most often relating to their level of commitment, effort, or understanding).

The quick-to-construct chart reveals the frequency and distribution of responses. Although anonymous, it allows individuals to view their response in relation to the others in the group.

The Consensogram gives voice to the silent majority and perspective to the vocal minority.

At QLA, we use frequently use the Consensogram: applying it to diverse situations for the purpose of obtaining important data to better inform ‘where to next’.

How to

  1. Predetermine the question relating to the data to be collected.  Make sure the question is seeking a personalised response – it contains an “I” or “my” or “me”. We want people to give their view. E.g. “To what degree am I committed to…” or “To what degree do I understand…”  It can help to begin the question with ‘To what degree…’
  2. Predetermine the scale you wish to use. The scale may be zero to 10 or a percentage scale between zero and 100 percent.
  3. Issue each person with one sticky note. Make sure the sticky notes are all the same size. Colour is not important.
  4. Explain that you want people to write a number on their sticky note in response to the question posed.
    • No negative numbers.
    • If using the zero to 10 scale: the number should be a whole number (not a fraction e.g. 3¾ or 3.75, 55%), and a six or nine should be underlined so they can be distinguished.
    • If using the zero to 100% scale, the numbers should be multiples of ten percent, i.e. 0%, 10%, 20%, and so on.
    • Names are not required on the sticky notes.
  5. Ask people to write down their response. This shouldn’t take long!
  6. Collect the sticky notes and construct the Consensogram, usually on flip chart paper. Label the consensogram with the question and a vertical axis showing the scale.
  7. Interpret the Consensogram with the group and use it to inform what to do next.
  8. Capture a record of your Consensogram by taking a photograph or saving the data on a spreadsheet. You can use a Consensogram template.

Some examples

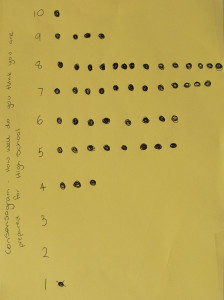
Students feeling prepared for high school

Consensogram: students feeling prepared for high school

This first example was prepared by a classroom teacher to determine how confident Year 6 students were feeling about their transitioning to high school.

So what do the data reveal?

  • There is significant variation; the students believe they are prepared to different degrees for their move to high school (scores range from 10 to 4).
  • There is one outlier (special cause) – that is; one student who is  having a very different experience to others in the class (giving a rating of one). They report that they feel unprepared for the transition.

So where to next?

  • There is opportunity to improve student confidence by working with the whole class to identify and work together to eliminate or minimise the biggest barriers to their feeling prepared.
  • There is opportunity to invite the student who is feeling unprepared to work with the teacher one-on-one (case manage) to address their specific needs for transiting. This student should not be singled out in front of the class, but an invitation issued to the whole class for that individual to have a quiet word with the teacher at a convenient time. The ensuing discussion may also inform the transitioning process for the rest of the class.


Student engagement

This example was created during a QLA professional development

Consensogram: how engaged are students in my classroom?

workshop with a small group of 11 teachers.

The question was: “To what degree are my students fully engaged: taking responsibility for their learning, setting their own goals and tracking their progress?”

So what do the data reveal?

  • There is variation; the teachers believe their students are at different levels of engagement in their classroom.
  • The data appears normally distributed data (a bell curve); there are no outliers (special causes) – that is; none of the teachers are having a very different experience to others in the group.

So where to next?

  • There is opportunity to improve student engagement; all of the data points are below 5 on the scale.
  • This data can help the group to understand the agreed current state and can motivate people to engage with improvement. It can also provide baseline data to monitor the impact of improvement efforts in the future.

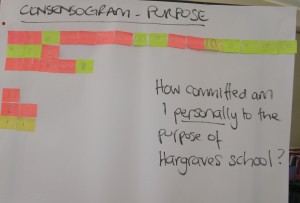
Commitment to school purpose

This example was created during school strategic planning with key stakeholders of a small school (parents, staff and students). A draft

Consensogram: how committed am I to our school purpose?

purpose statement was developed using stakeholder input (using a P3T Tool). The Consensogram was then used to measure the level of commitment to the draft statement. The question was: “How committed am I personally to the purpose of the school?”

The use of the Consensogram averted the need for long, frequently unproductive dialogue. It revealed the following:

  • There is variation; the stakeholders exhibit different levels of commitment to the school purpose.
  • Most are stakeholders are highly committed (the majority indicating a commitment level of 8-10).
  • A group of five stakeholders are less committed (a commitment level of 4-6). Their experience may be different to others in the group.

So where to next?

  • This presents an opportunity to invite the stakeholders with a different experience to share. It is very likely something can be learned to improve the purpose statement for everyone.

Learn more…

Watch a video example of a Consensogram being used for school planning (Hargraves System Mapping) on YouTube.

Investigate the key quality  improvement tools and concepts underpinning the use of the Consensogram, plus more examples in Improving Learning: A how to guide for school improvement.

Purchase a Using data to improve guide.

Download a Consensogram MS Excel template.

A recipe for building an expert teaching team

Do you need a step-by-step guide to targeting professional learning to develop your expert teaching team? Then follow these simple instructions to establish an evidence-based, structured process to plan,  monitor and evaluate the professional development of staff in your school:

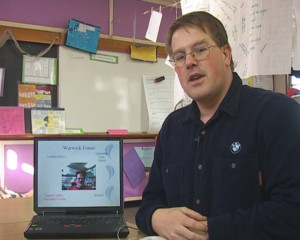
Warwick Fraser and his digital portfolio
Warwick Fraser explains how he uses his Capacity Matrix and Digital Portfolio
  1. Download a capacity matrix template. You can use the matrix in either hardcopy or digital format.
  2. Agree with staff what they need to know, understand and be able to do to be effective in their school roles. Identify the specific skills and capacities as they relate to key concepts and methods. Insert them into the matrix template. Draw on preferred models and professional standards like the AITSL Australian Professional Standards for Teachers. Be sure to also include the capacities unique to your school system (e.g. do you have a school-based data software people need to know how to use, a behaviour management policy, a role call process?). 
    Also consult your Strategic and Annual Plans for new developmental needs and these capacities to the matrix. In this way the matrix is a dynamic (ever evolving) document subject to ongoing review and improvement.
  3. Have each staff member undertake a regular self-assessment using the matrix. This self-assessment can be made an integral part of your school staff performance management/development process.
  4. Staff (like younger learners) are required to provide evidence of their learning. Evidence is recorded in the evidence column of the matrix. Staff can use a portfolio to store their evidence (in the same way as students do). This can take many forms; video footage or podcasts of teachers demonstrating good teaching practice, photos, students articulating their learning. This evidence is an effective measure of the extent to which professional learning is ultimately applied in the classroom.
  5. Use the capacity matrix to identify individual learning goals and monitor progress towards achieving them.
  6. Use the matrix as a basis for the induction of new staff.
  7. Use the matrix to plan ongoing professional development. Identify those areas where a majority of staff require professional development and plan the most cost-effective way for this to be facilitated. For example, those staff who have reached mastery (or are at the wisdom level) in specific capacities can teach, coach or mentor those at lower levels of learning.
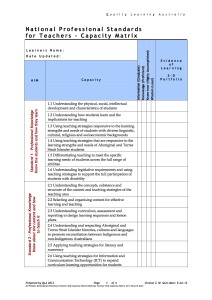
National Teacher Stds Capacity Matrix Ver1 03Jul12

Here are some we prepared earlier!

Want to know more…?