The Forcefield Analysis is another important tool in our quality improvement toolbox. It helps us to focus on getting the right things right.

A Forcefield Analysis is used to examine the forces driving and inhibiting progress in any area of endeavour. It was developed by Kurt Lewin. Lewin was one of the most influential social psychologists of the 20th century, recognised for his pioneering work in organisation dynamics and change.
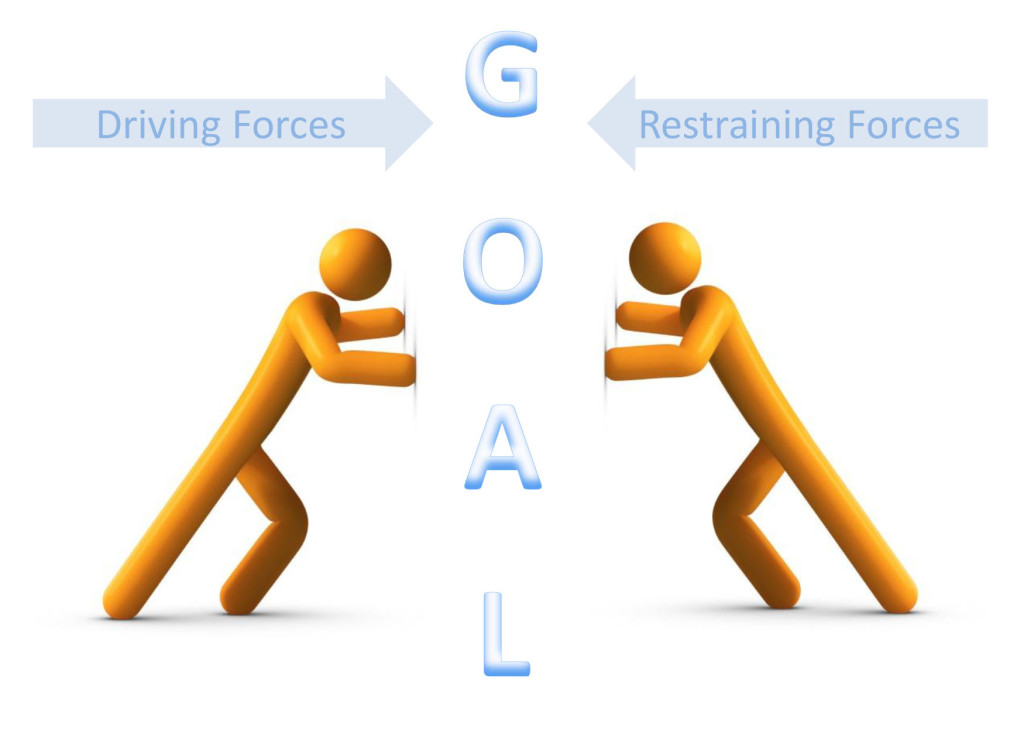
The theory is based upon an understanding that our organisations exist in a state of equilibrium. Driving and restraining forces ‘hold’ the organisational system in the observed steady state. If we wish to move the system to a new state, we must alter the forces acting on the system and shift the equilibrium.
And here’s the most important point when it comes to improving systems:
We derive a greater return on our improvement efforts by working to minimise the restraining forces, than by increasing the driving forces.
Of course, applying effort to maintain the driving forces is important. However, the restraining forces represent the longest levers to improvement.
Once the restraining forces are identified, the relative contribution of each can be established. This can be achieved through further data collection, or by working with the people with the greatest understanding of the area under study.
We offer a couple of examples to illustrate this in practice.

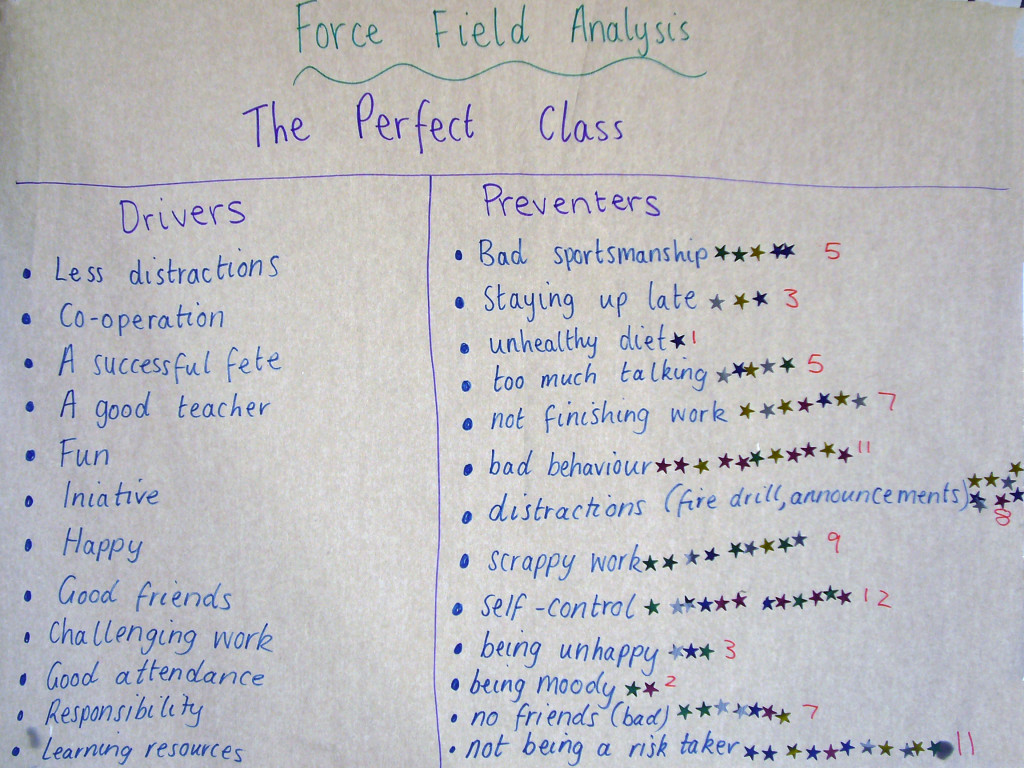
The first Forcefield Analysis was developed by students working with their teacher to improve their classroom. Together they brainstormed the forces they believed were helping to create a perfect learning environment, and then, the forces preventing this desired state. They then used Multi-voting; each student applied three votes (star stickers) to the list of preventing forces. A ‘lack of self-control’ was the preventing force they agreed was having the greatest negative effect. They then went on to agree how they could work on their self-control – with great results!

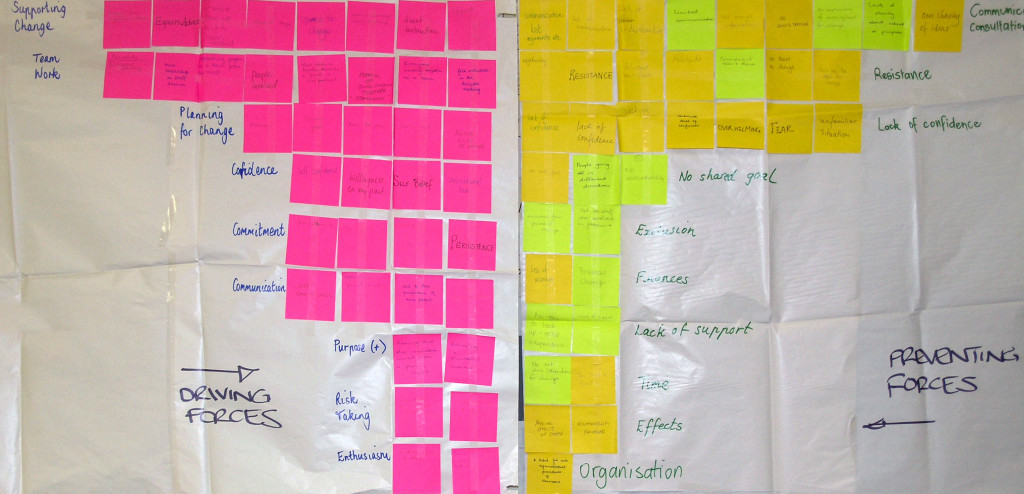
In this second example, we used the Forcefield Analysis in a workshop to explore participants’ experience of change. They used pink sticky notes to record what they believed were the driving forces of successful change, and yellow sticky notes to document the forces they believed inhibited change efforts. An Affinity Diagram was used to identify the themes of both the driving and inhibiting forces. The themes were arranged in order of the frequency in which they occurred, as a Pareto Chart. This was a most insightful exercise; helping participants to reflect on, and improve, their improvement efforts. They identified steps they can take to ensure that the greatest restraining forces are minimised in planning future change processes.
How to
- Use poster size paper (or smaller for individual use) with sticky notes or write directly onto the paper.
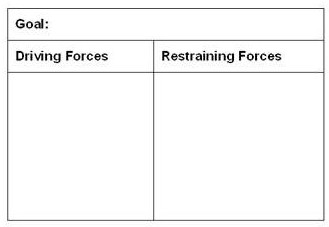
- Draw up a Forcefield Analysis template. Write down the goal. Divide the page into two columns. Label each column, one driving forces and the other restraining forces:
- Brainstorm a list of the driving forces.
- Brainstorm a list of the restraining forces.
- Prioritise the restraining forces using Multi-voting and/or an Interrelationship Digraph. (You may need to collect data to do this well!)
- Develop a plan to overcome the prioritised restraining force/s.
Find out more…
Learn more about Quality Learning tools.
Purchase a Tool Time for Education or Tool Time for Business recipe book.
We’d love to hear about your experiences using the Forcefield Analysis tool. Please comment.

